Contents
はじめに
ある程度投資を行っていくと銘柄の選定,買い時や売り時の判断のために自分で株価データを自由に扱いたいというニーズが出てくると思います。この記事では,Yahoo Financeのページから自分が知りたい銘柄の時系列株価データをダウンロードする方法を紹介します。
この記事を読むことで,
MATLABを使用してYahoo Financeから自分の好きな銘柄の時系列株価データをダウンロードすることができます!
File Exchangeの活用
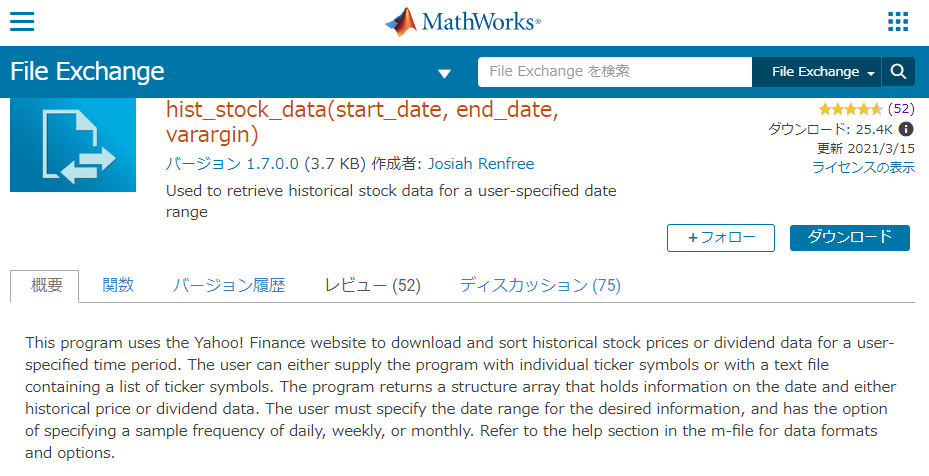
MATLABはユーザーコミュニティが充実していて,その特徴的なもののひとつにFile Exchange という場があります。File Exchangeは,ユーザーが自作した関数やアプリなどを共有していて,世界中のMATLABユーザーの英知が結集された夢のような場所です。今回は,その世界中の優秀なMATLABユーザーから,株価データを取得するお知恵を拝借します。ダウンロード数も多く高評価レビューも多そうだったのでこちらのJosiah Renfree氏の作成したhist_stock_data関数を使用させてもらいます。ダウンロードボタンからm fileと関連するドキュメントをダウンロードすることができます。
それでは早速コードの中身を見ていきます。2行目からのコメントで使い方を詳しく書いてくださっています。銘柄の指定方法や取得データの間隔(日次か週次かなど)などでいくつかのオプションがありますが,3行目で明記されている株価取得の開始日(X)と終了日(Y),銘柄(Ticker)を引数で渡すパターンが一番シンプルかと思いますので,その例でデータを取得してみます。実際のデータ取得に関わる部分のコード(146行目あたりから)を見てみるとやっていることはとてもシンプルで,引数で指定した期間,銘柄のデータをYahoo FinanceのHistorical Dataからダウンロードしています。
function stocks = hist_stock_data(start_date, end_date, varargin)
% HIST_STOCK_DATA     Obtain historical stock data
%   hist_stock_data(X,Y,'Ticker1','Ticker2',...) retrieves historical stock
%   data for the ticker symbols Ticker1, Ticker2, etc... between the dates
%   specified by X and Y.  X and Y can either be strings in the format
%   ddmmyyyy or Matlab datenums, where X is the beginning date and Y is the
%   ending date.  The program returns the stock data in a structure giving
%   the Date, Open, High, Low, Close, Volume, and Adjusted Close price
%   adjusted for dividends and splits.
%
%   hist_stock_data(X,Y,'tickers.txt') retrieves historical stock data
%   using the ticker symbols found in the user-defined text file.  Ticker
%   symbols must be separated by line feeds.
%
%   hist_stock_data(X,Y,{'Ticker1' 'Ticker2'}) combined the ticker symbols
%   into a single cell array when calling hist_stock_data (sometimes easier
%   for calling the funtion with a cell array of ticker symbols).
%
%   hist_stock_data(X,Y,'Ticker1','frequency',FREQ) retrieves historical
%   stock data using the frequency specified by FREQ, which must be either
%   'd' for daily, 'wk' for weekly, or 'mo' for monthly.
%
%   hist_stock_data(X,Y,'Ticker1','type','div') retrieves dividend data. If
%   anything but 'div' is specified then it will default to retrieving
%   historical prices.
%
%   EXAMPLES
%       stocks = hist_stock_data('23012003','15042008','GOOG','C');
%           Returns the structure array 'stocks' that holds historical
%           stock data for Google and CitiBank for dates from January
%           23, 2003 to April 15, 2008.
%
%       stocks = hist_stock_data('12101997','18092001','tickers.txt');
%           Returns the structure arrary 'stocks' which holds historical
%           stock data for the ticker symbols listed in the text file
%           'tickers.txt' for dates from October 12, 1997 to September 18,
%           2001.  The text file must be a column of ticker symbols
%           separated by new lines.
%
%       stocks = hist_stock_data(now-10, now, {'GOOG' 'C'});
%           Get stock data for approximately the last 10 days for the two
%           tickers specified in the cell array.
%
%       stocks = hist_stock_data('12101997','18092001','C','frequency','w')
%           Returns historical stock data for Citibank using the date range
%           specified with a frequency of weeks.  Possible values for
%           frequency are d (daily), wk (weekly), or mo (monthly).  If not
%           specified, the default frequency is daily.
%
%       stocks = hist_stock_data('12101997','18092001','C','type','div')
%            Returned historical dividend data for Citibank between Oct 12,
%            1997 and September 18, 2001.
%
%   DATA STRUCTURE
%       INPUT           DATA STRUCTURE      FORMAT
%       X (start date)  ddmmyyyy            String
%       Y (end date)    ddmmyyyy            String
%       Ticker          NA                  String
%       ticker.txt      NA                  Text file
%       FREQ            NA                  String; 'd', 'wk', or 'mo'
%       TYPE            NA                  String; 'div'
%
%   OUTPUT FORMAT
%       All data is output in the structure 'stocks'.  Each structure
%       element will contain the ticker name, then vectors consisting of
%       the organized data sorted by date, followed by the Open, High, Low,
%       Close, Volume, then Adjusted Close prices.
%
%   DATA FEED
%       The historical stock data is obtained using Yahoo! Finance website.
%       By using Yahoo! Finance, you agree not to redistribute the
%       information found therein.  Therefore, this program is for personal
%       use only, and any information that you obtain may not be
%       redistributed.
%
%   NOTE
%       This program uses the Matlab command urlread in a very basic form.
%       If the program gives you an error and does not retrieve the stock
%       information, it is most likely because there is a problem with the
%       urlread command.  You may have to tweak the code to let the program
%       connect to the internet and retrieve the data.
% Created by Josiah Renfree
% January 25, 2008
stocks = struct([]);        % initialize data structure
%% Parse inputs
% Format start and end dates into Posix times. This is the number of
% seconds since Jan 1, 1970. This previously used the posixtime function,
% but since that is relatively new, it now does the calculation using
% Matlab datenum's, which are in units of days, then converting to seconds.
origDate = datenum('01-Jan-1970 00:00:00', 'dd-mmm-yyyy HH:MM:SS');
% Convert input dates to Matlab datenums, if necessary
if ischar(start_date)
    startDate = (datenum(start_date, 'ddmmyyyy') - origDate) * 24 * 60 * 60;
else
    startDate = (floor(start_date) - origDate) * 24 * 60 * 60;
end
if ischar(end_date)
    endDate = (datenum(end_date, 'ddmmyyyy') - origDate) * 24 * 60 * 60;
else
    endDate = (floor(end_date) - origDate) * 24 * 60 * 60;
end
% determine if user specified frequency
temp = find(strcmp(varargin,'frequency') == 1); % search for frequency
if isempty(temp)                            % if not given
    freq = 'd';                             % default is daily
else                                        % if user supplies frequency
    freq = varargin{temp+1};                % assign to user input
    varargin(temp:temp+1) = [];             % remove from varargin
end
clear temp
% determine if user specified event type
temp = find(strcmp(varargin,'type') == 1); % search for frequency
if isempty(temp)                            % if not given
    event = 'history';                      % default is historical prices
else                                        % if user supplies frequency
    event = varargin{temp+1};               % assign to user input
    varargin(temp:temp+1) = [];             % remove from varargin
end
clear temp
% If the first cell of varargin is itself a cell array, assume it is a cell
% array of ticker symbols
if iscell(varargin{1})
    tickers = varargin{1};
% Otherwise, check to see if it's a .txt file
elseif ~isempty(strfind(varargin{1},'.txt'))
    fid = fopen(varargin{1}, 'r');
    tickers = textscan(fid, '%s'); tickers = tickers{:};
    fclose(fid);

% Otherwise, assume it's either a single ticker or a list of tickers
else
    tickers = varargin;
end
%% Get historical data
h = waitbar(0, 'Please Wait...');           % create waitbar
idx = 1;                                    % idx for current stock data
% Cycle through each ticker symbol and retrieve historical data
for i = 1:length(tickers)

    % Update waitbar to display current ticker
    waitbar((i-1)/length(tickers), h, ...
        sprintf('Retrieving stock data for %s (%0.2f%%)', ...
        tickers{i}, (i-1)*100/length(tickers)))

    % Create url string for retrieving data
    url = sprintf(['https://query1.finance.yahoo.com/v7/finance/download/', ...
        '%s?period1=%d&period2=%d&interval=1%s&events=%s'], ...
        tickers{i}, startDate, endDate, freq, event);

    % Create webread options variable to specify UserAgent
    options = weboptions('UserAgent', 'Mozilla/5.0');

    % Try to download stock data. Put in try/catch block in case it fails
    try
        temp = webread(url, 'matlabstockdata@yahoo.com', 'historical stocks',...
               options);

    % If data retrieval fails, skip to next ticker
    catch
        continue
    end

    % Write ticker symbol
    stocks(idx).Ticker = tickers{i};

    % Put data into appropriate variables
    if strcmp(event, 'history')     % If historical prices
        stocks(idx).Date = temp.Date;
        stocks(idx).Open = temp.Open;
        stocks(idx).High = temp.High;
        stocks(idx).Low = temp.Low;
        stocks(idx).Close = temp.Close;
        stocks(idx).AdjClose = temp.AdjClose;
        stocks(idx).Volume = temp.Volume;

    else                            % If dividends
        stocks(idx).Date = temp.Date;
        stocks(idx).Dividend = temp.Dividends;
    end
    % Increment stock index
    idx = idx + 1;
    % update waitbar
    waitbar(i/length(tickers),h)
end
close(h) % close waitbarYahoo Finance から株価データをダウンロードする
Googleの株価データをダウンロードしてみる
株価の取得開始日と終了日,GoogleのTickerの 'GOOG'を引数として渡してあげます。2005年12月31日から2023年9月30日までのデータを取得してみます。
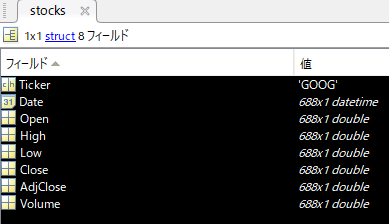
stocks = hist_stock_data('31122005','30092023','GOOG');実行結果
stocks の中身はこんな感じです。Dateは,日付情報,Openが始値,Highが高値,Lowが安値,Closeが終値,AdjCloseは調整後終値,Volumeが出来高です。
試しに終値をプロットしてみます。
plot(stocks.Date,stocks.AdjClose)
ylabel('Price, USD')
title('Stock price history of Google')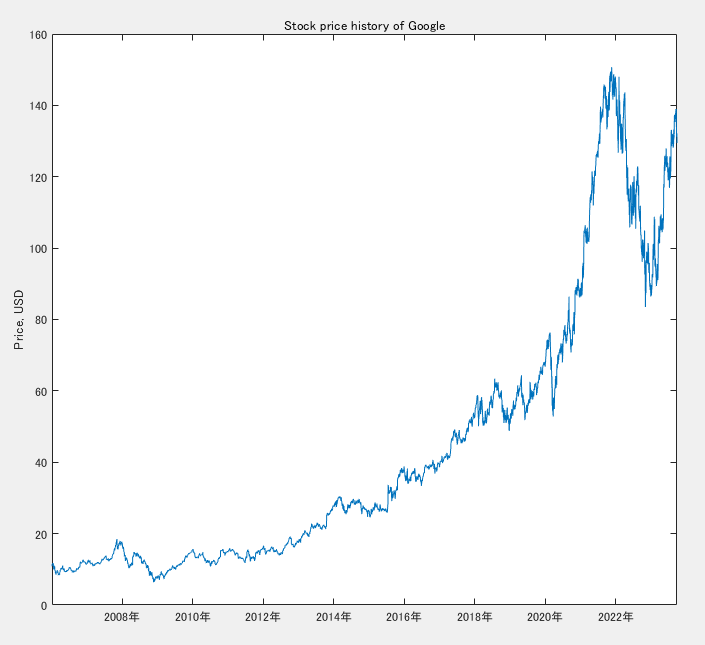
これで無事に,自分の手元で株価データを自由に扱えるようになりました。
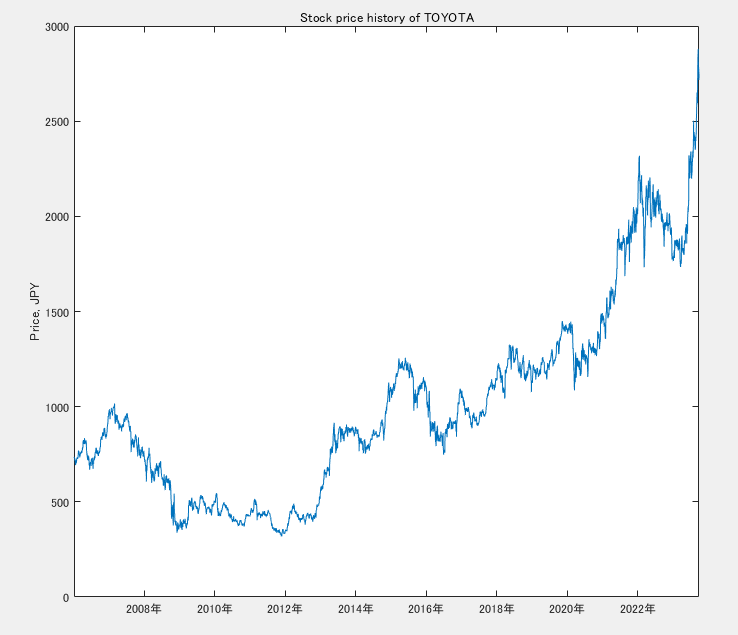
日本株の場合は「証券コード.T」
日本株のデータを取得したい場合は,Tickerを「証券コード.T」とすれば取得することができます。試しにトヨタ自動車の同期間の株価を取得してみましょう。トヨタ自動車の証券コードは,7203なので,Tickerを「7203.T」とします。
stocks = hist_stock_data('31122005','30092023','7203.T');

plot(stocks.Date,stocks.AdjClose)
ylabel('Price, JPY')
title('Stock price history of TOYOTA')実行結果
無事に取得することができました。
まとめ
この記事では,MATLAB File Exchanger で公開されている関数を使用して,自分の好きな銘柄の時系列株価データをYahoo Financeから取得する方法を紹介しました。銘柄指定の自由度が高く,操作もシンプルなJosiah Renfree氏の作成したhist_stock_data関数はおすすめです。